Using AI to compare IMF metrics of CFA franc zone countries to non-CFA Middle-Africa and West-Africa countries
Author
Eduardo Lazaro Zevallos
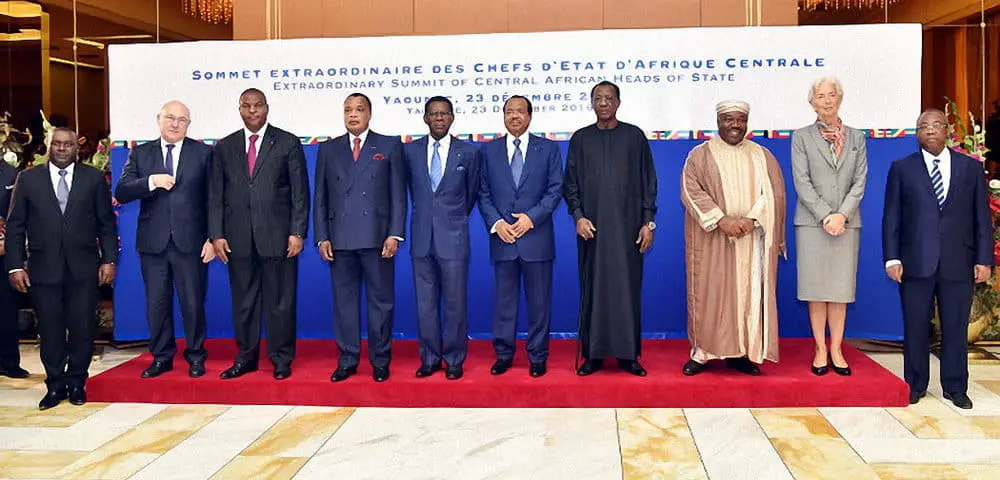
Michel Sapin, France’s finance minster, and Christine Lagarde, managing director of the IMF, with CEMAC heads of state after agreeing ‘to start and conclude bilateral negotiations with the IMF in the near future’
Credit
Credit is due to Fanny Pigeaud and Ndongo Samba Sylla. A lot of the information and inspiration presented here is originally sourced from their book, “Africa’s Last Colonial Currency: The CFA Franc Story.”
Introduction
Abstract
This analysis uses AI to compare the median per year for various IMF metrics of CFA franc zone countries to non-CFA franc zone African countries in the Western and Middle Africa region. The purpose of this analysis is to challenge the claim that the CFA franc zone promotes growth and development. It’s important to note that this analysis does not suggest that the CFA franc is the sole cause of underdevelopment in these countries.
Background
The CFA franc, originally the French African Colonial franc, was created in 1945 and imposed on France’s colonies.
The CFA franc zone of today is an area of monetary cooperation, composed of two African economic zones: the West Africa Economic and Monetary Union (WAEMU) and the Central African Economic and Monetary Union (CEMAC), along with Comoros.
The countries in the CFA franc zone for this analysis are:
Guinea-Bissau joined the WAEMU in 1997, Mali joined the WAEMU in 1984 and Equatorial Guinea joined the CEMAC in 1985, so any metrics before the year a country joined is considered non-CFA franc zone and any metrics equal to or greater than the year a country joined the CFA franc zone is considered CFA franc zone.
The Comoros is ommited from this analysis, it is part of the East Africa region and uses the Comorian Franc.
Overall, more than 162 million people use the two CFA francs. The CFA franc zone is based on four interrelated principles:
fixed exchange rate
free movement of capital
free convertibility of the currency
centralization of foreign exchange reserves
Key decisions concerning the CFA franc zone are made in Paris. The central actor in this system is the French Treasury. All foreign exchange transactions (the purchase or sale of CFA francs) of the 15 countries in the franc zone must go through the French Treasury due to the French guarantee of unlimited convertibility of CFA francs into euros. This makes France the only country in the world that directly manages a set of currencies distinct from its own.
Supporters of the CFA franc system suggest that it provides monetary stability, economic attractiveness, investment inflows, and an increase in the growth rate.
The idea that the CFA franc promotes growth and development has been widely touted by the Bank of France. In 2015, the Bank of France stated, “For over forty years, the franc zone has been an instrument of solidarity and development aimed at consolidating growth, reducing poverty, and deepening regional integration.” Additionally, in 2012, Christian Noyer, the governor of the Bank of France, remarked, “The last fifty years have shown that the franc zone is a favorable factor for development.”
However, the CFA franc zone has four major downsides for the countries that are part of it:
an excessively rigid exchange rate regime
a problematic pegging to the euro
the underfinancing of African economies
a free movement of capital that generates a massive financial bleed-out
Disclaimer
The text below the graphs, labeled “Definition of {indicator}” and “Comparing Median Intervals for indicator {indicator},” is generated by ChatGPT 3.5 using this prompt. The purpose of the prompt is to provide a definition for each indicator and then draw a conclusion comparing the the CFA franc zone and non-CFA franc zone countries based on count in which the median was greater across the yearly intervals for the given indicator. For example, if non-CFA countries had a higher median GDP 18 times out of the 22 yearly intervals between 1980 and 2022, the prompt will draw a conclusion based on that count.
The graphs presented in the “Analysis” section support my challenge to the idea that the CFA franc zone is beneficial for economic growth and development. The graphs in the appendix are created from the same IMF data source with the same prompt.
This section emphasizes IMF metrics that challenge the assertion that the CFA franc zone fosters growth and development. It achieves this by comparing the median metrics of non-CFA franc zone countries with those of CFA franc zone countries.
GDP Per Capita, Current Prices comparison between African CFA Zone Countries to Non-CFA Middle Africa and Western Africa Countries
Definition of GDP Per Capita, Current Prices
GDP per capita, measured in U.S. dollars, is a significant indicator of a country’s economic growth and development. It captures the total value of final goods and services produced within a country during a specified time period, divided by the average population for the same one year. This measure provides a per capita perspective, allowing for meaningful comparisons between countries with different population sizes. Moreover, GDP per capita, when measured in current prices, reflects the economic activity at a given point in time. It serves as a yardstick to assess the standard of living, economic progress, and level of development in a country. Monitoring changes in GDP per capita over time helps policymakers, investors, and researchers to analyze economic trends, make informed decisions, and assess the effectiveness of economic policies.
Comparing Median Intervals for indicator GDP Per Capita, Current Prices
Higher GDP Per Capita, Current Prices generally promotes economic growth and development as it indicates the total value of final goods and services produced per person within a country. Comparing the median GDP Per Capita, Current Prices between CFA franc zone countries and non-CFA middle/west Africa countries from 1980 to 2023, it can be observed that non-CFA middle/west Africa countries had more yearly intervals with a higher median. This suggests that non-CFA middle/west Africa countries have experienced relatively more economic growth and development in terms of per capita income compared to CFA franc zone countries. However, it is important to consider various factors such as government policies, infrastructure, and institutional frameworks that may influence differences in economic performance between these two groups of countries.
GDP Per Capita, Current Prices comparison between African CFA Zone Countries to Non-CFA Middle Africa and Western Africa Countries
Definition of GDP Per Capita, Current Prices
Per capita GDP, measured in purchasing power parity (PPP) international dollars, provides a valuable indicator of a country’s economic growth and development. It represents the total value of final goods and services produced within a country during a specified time period, divided by the average population for the same one year. The use of PPP, which accounts for differences in price levels across countries, allows for a more accurate comparison of living standards and economic productivity. By measuring GDP per capita in PPP terms, economists can assess the relative economic well-being and progress of different countries, facilitating policy discussions and planning. This indicator provides important insights into a country’s economic performance, revealing patterns of growth, income distribution, and potential for development.
Comparing Median Intervals for indicator GDP Per Capita, Current Prices
According to the provided data, it is evident that non-CFA middle/west Africa countries have experienced more yearly intervals with a higher median GDP per capita, current prices compared to CFA franc zone countries from 1980 to 2023. This indicates a potential association between a higher GDP per capita and economic growth and development. The relative economic performance of non-CFA middle/west Africa countries suggests that they have been able to foster more sustained improvements in living standards and economic prosperity over the analyzed period. It is important to acknowledge that multiple factors contribute to economic growth and development, and further analysis is necessary to understand the specific dynamics at play. Nevertheless, the observed divergence in GDP per capita trends between the two groups of countries is worth considering when evaluating their respective economic performances.
Implied PPP Conversion Rate comparison between African CFA Zone Countries to Non-CFA Middle Africa and Western Africa Countries
Definition of Implied PPP Conversion Rate
The concept of Implied PPP Conversion Rate, measured in National currency per international dollar, serves as an essential indicator of a country’s economic growth and development. It captures the relative purchasing power of a nation’s currency by comparing it to the international dollar, which is adjusted for price level differences between countries. By employing Purchasing Power Parity (PPP) theory, which analyzes changes in price levels between countries, the Implied PPP Conversion Rate provides insight into a country’s competitiveness in the global market. A higher Implied PPP Conversion Rate indicates a stronger economy and higher level of development, as it signifies that domestic currency can purchase more goods and services in comparison to the international benchmark. Consequently, policymakers and economists can utilize this indicator to understand a nation’s industrial competitiveness, trade potential, and overall economic performance.
Comparing Median Intervals for indicator Implied PPP Conversion Rate
A higher Implied PPP Conversion Rate, as evidenced in the median values for CFA franc zone countries compared to non-CFA middle/west Africa countries from 1980 to 2023, can be indicative of a conducive environment for economic growth and development. This suggests that CFA franc zone countries may have experienced more intervals with a higher Implied PPP Conversion Rate, reflecting relatively stronger purchasing power and competitiveness in the global market. However, it is important to note that the Implied PPP Conversion Rate is just one facet and should be interpreted in conjunction with other economic indicators to assess the overall development picture. Therefore, a concise comparative insight between CFA franc zone countries and non-CFA middle/west Africa countries based on the Implied PPP Conversion Rate indicates potential variations in their respective economic growth trajectories.
Current Account Balance comparison between African CFA Zone Countries to Non-CFA Middle Africa and Western Africa Countries
Definition of Current Account Balance
The Current Account Balance, measured in Billions of U.S. dollars, is a key indicator of a country’s economic growth and development. It serves as a comprehensive record of all transactions in the balance of payments, including the exports and imports of goods and services, payments of income, and current transfers between residents and nonresidents. A positive current account balance signifies that a country is exporting more than it imports, which suggests a robust export sector and a competitive position in the global market. This surplus can support economic growth and development by providing foreign exchange earnings, attracting investments, and improving the country’s overall fiscal position. Conversely, a negative current account balance implies a higher level of imports relative to exports. While this may not be inherently negative, a sustained and significant deficit can indicate structural weaknesses in the economy, such as an overreliance on imported goods or services, which can hinder growth and development prospects. Therefore, monitoring and managing the current account balance is essential for policymakers to assess a country’s economic health, identify potential vulnerabilities, and formulate appropriate policy responses.
Comparing Median Intervals for indicator Current Account Balance
The impact of a higher Current Account Balance on economic growth and development is complex. It is important to note that a positive Current Account Balance generally indicates a country is exporting more than it imports, which can contribute to economic growth by generating foreign exchange earnings, attracting investments, and improving fiscal positions. However, it is equally crucial to consider other factors that influence growth, such as domestic policies, investment climate, infrastructure, and diversification of the economy. Regarding the comparative insight between the CFA franc zone countries and non-CFA middle/west Africa countries, the provided data shows that non-CFA middle/west Africa countries had more yearly intervals with a higher median Current Account Balance from 1980 to 2023. This finding suggests that, in terms of Current Account Balance, these non-CFA countries potentially have had more favorable conditions for economic growth and development during this period. However, it is important to conduct further analysis to understand the underlying factors behind these variations and their implications for overall economic performance.
Primary Net Lending/Borrowing comparison between African CFA Zone Countries to Non-CFA Middle Africa and Western Africa Countries
Definition of Primary Net Lending/Borrowing
The concept of Primary Net Lending/Borrowing, measured in percentage of GDP, captures the fiscal stance and economic sustainability of a country. It pertains to evaluating a government’s ability to generate resources to cover its current expenditures and investments, excluding the interest payments. This indicator reflects the government’s impact on overall economic growth and development, as it provides an assessment of its ability to generate savings and invest in productive sectors, stimulate aggregate demand, and promote positive externalities through infrastructure development and public services provision. Assessing Primary Net Lending/Borrowing in relation to GDP allows for cross-country comparisons and monitoring fiscal discipline, as sustained positive levels indicate fiscal surpluses and potential for debt reduction, while negative values suggest borrowing requirements and the need to finance expenditures through external borrowing or increased taxation.
Comparing Median Intervals for indicator Primary Net Lending/Borrowing
The issue of whether a higher Primary Net Lending/Borrowing promotes economic growth and development is an ongoing debate among economists. However, based on the provided data from 1990 to 2023, it suggests that non-CFA middle/west Africa countries had more yearly intervals with a higher median Primary Net Lending/Borrowing compared to the CFA franc zone countries. This indicates that non-CFA middle/west Africa countries may have had more fiscal resources available to invest in productive sectors, stimulate aggregate demand, and promote economic growth. It is important to note that Primary Net Lending/Borrowing is only one indicator, and a comprehensive analysis considering other factors such as government policies, institutional frameworks, and external factors would provide a more accurate assessment of a country’s economic growth and development.
Real GDP Growth Rate, per capita comparison between African CFA Zone Countries to Non-CFA Middle Africa and Western Africa Countries
Definition of Real GDP Growth Rate, per capita
Real GDP Growth Rate, per capita measured in % change, is a crucial measure of a country’s economic progress and development. It indicates the annual percentage change in the inflation-adjusted value of goods and services produced in a country, divided by its population. This measure allows a comparison of economic performance across countries, as it accounts for differences in population size. A higher growth rate signifies an expanding economy, increased productivity, and improved living standards. It indicates that a country is generating more output and resources, which can be allocated towards public investments, social welfare, and poverty reduction. Real GDP Growth Rate, per capita, is an essential indicator for policymakers, providing insights into the overall health and potential of an economy, while guiding decisions related to fiscal and monetary policies, investments, and long-term planning.
Comparing Median Intervals for indicator Real GDP Growth Rate, per capita
A higher Real GDP Growth Rate, per capita generally serves as a positive indicator of economic growth and development. It signifies the ability of a country to enhance its productivity and generate increased output, ultimately resulting in improved living standards and welfare. Evaluating the median Real GDP Growth Rate, per capita from 2004 to 2023, it is evident that non-CFA middle/west Africa countries had more intervals with a higher median compared to the CFA franc zone countries. This suggests that the non-CFA countries experienced more consistent economic growth in terms of per capita output during this period. While the CFA franc zone may offer monetary stability and economic attractiveness, the rigidity of its exchange rate regime and other downsides may have hindered the growth potential of these countries. On the other hand, the non-CFA countries, not bound by the same monetary framework, seem to have been more successful in promoting sustained economic progress. These findings highlight the importance of flexible economic policies and the ability to adapt to changing market conditions in fostering long-term growth and development.
Broad Money Growth comparison between African CFA Zone Countries to Non-CFA Middle Africa and Western Africa Countries
Definition of Broad Money Growth
Broad money growth is a crucial measure of the rate at which the total supply of money in an economy is expanding. Expressed as a percentage change over a given period, it reflects the combination of both monetary and non-monetary components in the economy. This indicator plays a pivotal role in assessing a country’s economic growth and development as it provides insights into the availability of funds for investment, consumption, and overall economic activity. A higher broad money growth rate suggests increased liquidity, promoting higher spending and investment levels that can stimulate economic growth. Conversely, a low or negative growth rate may indicate tightening monetary conditions, potentially hindering economic expansion. Therefore, monitoring and analyzing broad money growth % change aids policymakers and analysts in understanding the monetary dynamics of an economy and formulating appropriate measures for sustained economic stability and development.
Comparing Median Intervals for indicator Broad Money Growth
Step 1 - Higher Broad Money Growth has the potential to promote economic growth and development, as it signifies increased liquidity in the economy, allowing for greater spending and investment. This liquidity enables businesses to access funds for expansion, stimulates consumer demand, and facilitates the financing of infrastructure projects. Moreover, a higher Broad Money Growth rate can incentivize banks to lend more, stimulating credit creation and supporting entrepreneurial activities. By fostering economic activity and investment, higher Broad Money Growth can contribute to employment generation, poverty reduction, and overall economic development.
Based on the median Broad Money Growth from 2004 to 2023, as indicated in the provided dataframe, non-CFA middle/west Africa countries had more yearly intervals with a higher median compared to the CFA franc zone countries. This suggests that the non-CFA countries experienced relatively higher levels of liquidity expansion, which can potentially indicate more favorable conditions for economic growth and development. However, it is essential to consider other factors such as fiscal policies, governance, and structural constraints that may influence the impact of Broad Money Growth on economic outcomes. Nevertheless, the observed disparity in Broad Money Growth between the two groups suggests a divergence in monetary dynamics and could imply varying prospects for economic growth and development.
Exports Of Goods And Services comparison between African CFA Zone Countries to Non-CFA Middle Africa and Western Africa Countries
Definition of Exports Of Goods And Services
The measure of Exports of Goods and Services as a percentage of Gross Domestic Product (GDP) provides crucial insights into a country’s economic growth and development. It reflects the extent to which a nation is engaged in international trade, showcasing its ability to compete in global markets. A higher percentage denotes a larger contribution of exports to the national economy, indicating positive growth and potential development. Countries with a diverse range of export-oriented industries and competitive advantages are likely to experience stronger economic performance, increased employment opportunities, and enhanced productivity levels. Furthermore, a robust export sector often signifies a favorable balance of trade, generating foreign exchange earnings and improving a nation’s financial stability, which can further stimulate domestic investments and overall economic growth. Thus, this measure acts as a fundamental indicator of a country’s economic performance and its integration into the global economy, facilitating a comprehensive evaluation of its development trajectory.
Comparing Median Intervals for indicator Exports Of Goods And Services
Step 1 - A higher percentage of Exports of Goods and Services generally promotes economic growth and development as it indicates a country’s ability to engage in international trade and compete in global markets. Increased exports contribute to higher GDP, stimulate domestic industries, create employment opportunities, and attract foreign investments. Additionally, a strong export sector enhances a nation’s financial stability through foreign exchange earnings and improves its balance of trade.
Based on the median values of Exports of Goods and Services from 2004 to 2023 for the CFA franc zone and non-CFA middle/west Africa countries, it can be observed that non-CFA middle/west Africa countries had more yearly intervals with a higher median. This suggests that non-CFA middle/west Africa countries have experienced a relatively stronger performance in terms of export-oriented economic growth and development compared to countries in the CFA franc zone. However, a comprehensive analysis would require considering other factors such as the size and diversity of the economies, trade policies, market access, and technological capabilities of the respective countries.
Net Foreign Direct Investment comparison between African CFA Zone Countries to Non-CFA Middle Africa and Western Africa Countries
Definition of Net Foreign Direct Investment
Net Foreign Direct Investment (FDI) as a percentage of GDP measures the inflow and outflow of direct investment between a country and the rest of the world, adjusted for the repatriation of profits. This indicator holds significance as it reflects a nation’s ability to attract and utilize foreign capital for productive activities, which can stimulate economic growth and development. A higher percentage suggests larger net inflows, indicating increased foreign investment that can contribute to job creation, technology transfer, infrastructure development, and overall economic expansion. Additionally, a positive net FDI/GDP ratio may imply a favorable investment climate, openness to global markets, and increased competitiveness on the global stage. Conversely, a negative ratio might indicate potential limitations in attracting foreign capital or a drain of economic resources, which could hinder growth prospects. Consequently, policymakers often pay close attention to net FDI/GDP as an essential gauge of a country’s economic progress and its ability to integrate into the global economy.
Comparing Median Intervals for indicator Net Foreign Direct Investment
A higher level of Net Foreign Direct Investment (FDI) is generally associated with promoting economic growth and development, according to empirical evidence. FDI brings in external capital, advanced technologies, managerial expertise, and access to international markets, which can stimulate productivity, job creation, and overall economic expansion. In the case of non-CFA middle/west Africa countries compared to CFA franc zone countries, the available data suggests that the former group had more yearly intervals with a higher median Net FDI from 2004 to 2023. This implies that non-CFA middle/west Africa countries may have been relatively more successful in attracting foreign capital, potentially contributing to their economic growth and development. However, it is important to consider other factors such as institutional quality, human capital, and infrastructure investment to provide a more comprehensive analysis of the divergent FDI performance between these two groups.
Conclusion
In conclusion, non-CFA Middle Africa and West Africa countries consistently had a higher median GDP per capita than CFA franc zone countries and a higher median real GDP growth rate, which tends to be one of the conventional ways to compare economic development between countries. CFA franc zone countries also had a higher median implied PPP conversion rates, suggesting that the currency is overvalued. This overvaluation is expected since both CFA francs in the CFA franc zone are pegged to the euro. An overvalued currency has the effect of making CFA franc zone exports less competitive, thus leading to fewer exports which can hinder the development of domestic production and the domestic economy. This claim is further supported by the consistently higher median of non-CFA countries to CFA franc zone countries when considering the metrics exports of goods and services and overall current account balances. In addition, non-CFA franc zone countries also had much higher levels of net foreign direct investment. This could be in part that their economies are able to attract more net investment and/or non-CFA countries don’t have the same levels of capital flight that CFA franc zone countries have due to the free movement of capital. This ultimately reinforces the challenge to the claim that the CFA franc zone promotes economic growth.
Appendix
The following charts were not as significant for the thesis of this analysis. All median graphs and text in this section are generated from the same IMF data source and chatgpt prompt as the previous section.
Real GDP Growth Rate comparison between African CFA Zone Countries to Non-CFA Middle Africa and Western Africa Countries
Definition of Real GDP Growth Rate
Real GDP Growth Rate, measured as the percentage change in the value of final goods and services produced within a country over a specified time period, is a crucial indicator of a country’s economic growth and development. This metric allows us to assess the overall increase in economic output, indicating the nation’s ability to generate and expand its production capacities. A higher real GDP growth rate suggests a stronger economy, as it signifies increased employment opportunities, improved standards of living, and potential for investment and innovation. Additionally, it helps policymakers and analysts gauge the effectiveness of economic policies and identify areas of improvement to foster sustainable economic development. By focusing on real GDP growth rate, we gain a comprehensive understanding of a country’s economic performance and its potential for long-term prosperity.
Comparing Median Intervals for indicator Real GDP Growth Rate
Real GDP Growth Rate plays a crucial role in promoting economic growth and development. Higher Real GDP growth rates usually indicate a country’s ability to generate and expand its production capacities, leading to increased employment opportunities, improved living standards, and potential for investment and innovation. However, when comparing the Real GDP Growth Rates between CFA franc zone countries and non-CFA middle/west Africa countries from 1980 to 2023, the data reveals that non-CFA middle/west Africa countries consistently had more yearly intervals with higher median growth rates. This suggests that these countries, operating outside the CFA franc zone, may have more flexibility in monetary and economic policies, enabling them to effectively stimulate economic growth and development.
GDP, Current Prices comparison between African CFA Zone Countries to Non-CFA Middle Africa and Western Africa Countries
Definition of GDP, Current Prices
Gross Domestic Product (GDP) is a widely recognized indicator utilized to evaluate a country’s economic growth and development. Measured in billions of U.S. dollars at current prices, GDP represents the total value of final goods and services produced within a country during a specific time frame, typically a year. It provides invaluable insights into the overall economic activity within a nation, reflecting the productivity and output of its various sectors. As a comprehensive measure, GDP encompasses both consumer and government spending, investments, and net exports, thereby offering a comprehensive assessment of a country’s economic performance. By tracking changes in GDP over time, policymakers and economists can discern the overall health of an economy, identify and address potential challenges, and implement effective strategies to foster sustainable economic growth and development.
Comparing Median Intervals for indicator GDP, Current Prices
GDP, measured in current prices, serves as a vital indicator of a country’s economic growth and development. It captures the total value of final goods and services produced within a specified time period, reflecting the overall economic activity. In evaluating the relationship between GDP and economic growth, it is important to note that higher GDP, Current Prices can indeed promote development by indicating increased productivity, investment, and consumption. Analyzing the provided data for CFA franc zone and non-CFA middle/west Africa countries from 1980 to 2023, it is evident that the CFA franc zone countries generally exhibited higher median GDP, Current Prices compared to their non-CFA counterparts. This comparison suggests that the CFA franc zone countries, with their monetary stability, investment inflows, and growth promotion, have potentially benefited from the system in terms of GDP growth and economic development. However, it is essential to consider other factors and potential downsides of the CFA franc zone system for a more comprehensive assessment of its impact.
GDP, Current Prices comparison between African CFA Zone Countries to Non-CFA Middle Africa and Western Africa Countries
Definition of GDP, Current Prices
Gross Domestic Product (GDP) measured in Purchasing Power Parity (PPP) represents the total value of final goods and services produced within a country during a specified time period, taking into account the differences in price levels between countries. This measure provides a more accurate reflection of a country’s economic growth and development as it considers the purchasing power of each country’s currency. By converting GDP to international dollars, PPP allows for a comparison of economic activity across countries, accounting for differences in the cost of living and the exchange rates. This indicator enables policymakers, economists, and investors to analyze and understand the relative economic performance and standard of living among different countries.
Comparing Median Intervals for indicator GDP, Current Prices
A higher GDP, Current Prices is generally considered a positive indication of economic growth and development. It signifies increased production and consumption of goods and services within a country, reflecting a thriving economy. In the case of the CFA franc zone countries, the provided data shows that they had more yearly intervals with a higher median GDP, Current Prices compared to the non-CFA middle/west African countries from 1980 to 2023. This suggests that, on average, the CFA franc zone countries experienced relatively stronger economic performance in terms of GDP, Current Prices during this period. However, it is important to note that GDP is just one measure and should be considered alongside other indicators to fully assess economic growth and development.
GDP Based On PPP, Share Of World comparison between African CFA Zone Countries to Non-CFA Middle Africa and Western Africa Countries
Definition of GDP Based On PPP, Share Of World
Purchasing Power Parity (PPP) is a crucial concept in understanding a country’s economic growth and development. It measures the total gross domestic product (GDP) of a country and compares it with other countries using a standardized set of prices. This approach provides a more accurate representation of a country’s economic standing by considering the relative purchasing power of its currency. By calculating the share of world GDP based on PPP, one can ascertain a country’s position in the global economy. This indicator holds significant importance as it allows for international comparisons, highlighting the relative size and economic strength of different nations. Consequently, policymakers and economists rely on this measure to assess and monitor a country’s economic progress, identify areas of improvement, and inform policies to stimulate sustainable growth. Ultimately, understanding the concept of GDP based on PPP and its significance contributes to a comprehensive evaluation of a country’s economic growth and development trajectory.
Comparing Median Intervals for indicator GDP Based On PPP, Share Of World
A higher GDP based on PPP, Share of World is generally associated with economic growth and development. It signifies a larger share of the global economy and reflects the relative strength and competitiveness of a country. In the case of the CFA franc zone countries compared to non-CFA middle/west Africa countries, the data provided suggests that CFA franc zone countries have experienced more yearly intervals with a higher median GDP based on PPP, Share of World from 1980 to 2023. Though there are multiple factors influencing economic growth and development, this observation implies that CFA franc zone countries have had a comparatively stronger presence in the global economy and may have experienced more favorable conditions for growth. However, it is important to note that GDP alone is not a comprehensive indicator of development, and other factors such as income distribution, poverty levels, and social indicators should also be considered in assessing economic progress.
Inflation Rate, Average Consumer Prices comparison between African CFA Zone Countries to Non-CFA Middle Africa and Western Africa Countries
Definition of Inflation Rate, Average Consumer Prices
The inflation rate, as measured by the percent change in the average consumer price index (CPI), plays a crucial role in reflecting a country’s economic growth and development. By tracking the average level of prices for a typical basket of consumer goods and services, the CPI provides insights into the overall cost of living for individuals. A low inflation rate is generally considered favorable as it enables stable purchasing power and provides individuals and businesses with a sense of predictability. On the other hand, a high inflation rate can erode the value of money, disrupt economic planning, and create uncertainties in financial markets. Therefore, monitoring the inflation rate and ensuring its stability is essential for policymakers to effectively manage and sustain a country’s economic growth and development.
Comparing Median Intervals for indicator Inflation Rate, Average Consumer Prices
A higher inflation rate, as measured by the average consumer prices, does not necessarily promote economic growth and development. In fact, excessive inflation can have detrimental effects on an economy, leading to reduced purchasing power, uncertainty in financial markets, and disruptions to economic planning. However, when comparing the inflation rate and average consumer prices between the CFA franc zone and non-CFA middle/west Africa countries from 1980 to 2023, it can be observed that the non-CFA countries generally had a higher median inflation rate. This suggests that these countries may have faced more challenges in controlling inflation and maintaining price stability over the years. It is important for policymakers to address inflationary pressures and implement appropriate monetary and fiscal policies to ensure sustainable economic growth and development in these countries.
Inflation Rate, End Of Period Consumer Prices comparison between African CFA Zone Countries to Non-CFA Middle Africa and Western Africa Countries
Definition of Inflation Rate, End Of Period Consumer Prices
The inflation rate, also known as the percent change in the end of period consumer price index (CPI), is an important indicator of a country’s economic growth and development. The end of period CPI represents the general level of prices in a country, based on the cost of a typical basket of consumer goods and services. By measuring the change in prices over time, the inflation rate provides insight into the pace of inflation and the erosion of purchasing power for consumers. Additionally, the inflation rate is closely monitored by policymakers, as it influences interest rates, wage negotiations, and business decisions. A low and stable inflation rate is generally associated with a healthy and sustainable economic environment, fostering investment, consumption, and long-term economic growth.
Comparing Median Intervals for indicator Inflation Rate, End Of Period Consumer Prices
Higher inflation rates, as measured by the percent change in end of period consumer prices, do not necessarily promote economic growth and development. While moderate inflation rates can be beneficial by stimulating consumption and investment, high and volatile inflation can have adverse effects on an economy. It erodes the purchasing power of individuals, reduces investment incentives, distorts price signals, and leads to uncertainty in planning and decision-making. Considering the provided data, non-CFA middle/west Africa countries have experienced higher median inflation rates compared to CFA franc zone countries from 1981 to 2023. This suggests a greater level of inflationary pressure in the non-CFA countries, which can hinder long-term economic growth and development due to its negative impacts on investment, consumption, and price stability.
Population comparison between African CFA Zone Countries to Non-CFA Middle Africa and Western Africa Countries
Definition of Population
Population, measured in millions of people, serves as a crucial indicator of a country’s economic growth and development. The magnitude of a nation’s population encapsulates the size of its labor force, market potential, and consumer base. A larger population can foster greater domestic productivity, as it provides a wider pool of human capital and a potential source of innovation. Moreover, an expanding population propels domestic demand, stimulating economic activity and fostering investments in infrastructure and public services. By gauging the scale of population, policymakers and economists can comprehend the challenges and opportunities associated with a country’s economic development and formulate appropriate strategies to enhance productivity, allocate resources efficiently, and create conducive conditions for sustained economic growth.
Comparing Median Intervals for indicator Population
Higher population has the potential to promote economic growth and development due to several factors. A larger population can contribute to a larger labor force, which can enhance productivity and drive economic output. Additionally, a larger consumer base within a country can increase domestic demand, leading to expanded markets and elevated investments in infrastructure and public services. Considering the provided population data from 1980 to 2023, it is evident that CFA franc zone countries generally experienced more intervals with a higher median population compared to non-CFA middle/west Africa countries. This implies that CFA franc zone countries may have had a greater advantage in terms of market potential, human capital, and overall economic prospects. However, it is essential to further investigate and consider other factors such as governance, resources, and policy frameworks to gain a comprehensive understanding of the development disparities between these regions.
Current Account Balance comparison between African CFA Zone Countries to Non-CFA Middle Africa and Western Africa Countries
Definition of Current Account Balance
The Current Account Balance, measured as a percentage of Gross Domestic Product (GDP), is a significant indicator of a country’s economic growth and development. It reflects the net trade in goods and services, income payments, and current transfers between the residents of a country and nonresidents. A positive current account balance signifies that a country is exporting more goods and services than it is importing, indicating a trade surplus. This can contribute to economic growth, as it represents increased foreign demand for domestic goods and can lead to an accumulation of foreign reserves. Conversely, a negative current account balance suggests a trade deficit and may be indicative of an economy relying heavily on imports or experiencing a decline in competitiveness. Monitoring the current account balance as a percentage of GDP allows policymakers to assess a country’s external economic position and make informed decisions to ensure sustainable economic growth and development.
Comparing Median Intervals for indicator Current Account Balance
A higher Current Account Balance, measured as a percentage of GDP, can potentially promote economic growth and development. This is because a positive balance indicates that a country is exporting more goods and services than it is importing, which can stimulate domestic production and increase employment opportunities. Moreover, a surplus in the current account can contribute to the accumulation of foreign reserves, enhancing a country’s capacity to invest in infrastructure, education, and other areas that foster long-term economic development. Analyzing the provided data, it is evident that CFA franc zone countries generally had more yearly intervals with a higher median Current Account Balance from 1980 to 2023 compared to non-CFA middle/west Africa countries. This suggests that the CFA franc zone may have experienced greater trade surpluses and potentially benefited from increased economic stability and investment inflows. However, it is essential to acknowledge the downsides of the CFA franc system, including an inflexible exchange rate regime and underfinancing of African economies. Evaluating the overall impact of the Current Account Balance on economic growth necessitates considering other factors and a comprehensive assessment of each country’s unique circumstances.
Extensive Margin comparison between African CFA Zone Countries to Non-CFA Middle Africa and Western Africa Countries
Definition of Extensive Margin
The Extensive Margin, as measured in Index, refers to the level of diversification in a country’s exports. It signifies the expansion or contraction in the number of products a country exports rather than the variations in the quantities of already exported products. As an indicator of economic growth and development, a high Extensive Margin suggests a more diverse export basket, enabling countries to mitigate vulnerabilities associated with dependence on a limited range of products. Furthermore, a greater Extensive Margin reflects a country’s ability to adapt and find new market opportunities, which can enhance resilience in times of economic uncertainty. Consequently, policymakers and analysts often consider the Extensive Margin of export diversification as an important measure of a country’s economic dynamism and potential for sustained growth.
Comparing Median Intervals for indicator Extensive Margin
Step 1: A higher Extensive Margin, indicating greater export diversification, can potentially promote economic growth and development. A diverse export basket allows countries to tap into multiple markets, reduce vulnerabilities associated with dependence on a limited range of products, and adapt to changing economic conditions. The ability to explore new market opportunities enhances resilience and can foster sustained growth. Therefore, economies with a higher Extensive Margin are likely to benefit from increased trade, investment inflows, and improved economic attractiveness, which contribute to overall development.
Concisely comparing Extensive Margin between CFA franc zone and non-CFA middle/west Africa countries, the data from 1980 to 2014 shows that CFA franc zone countries had more yearly intervals with a higher median Extensive Margin compared to non-CFA countries. This suggests that CFA franc zone countries, under the stability and attractiveness provided by the CFA franc system, may have been more successful in diversifying their export portfolios and adapting to market opportunities. However, it is important to consider that other factors, such as institutional arrangements, policy frameworks, and historical trade patterns, may also influence export diversification and economic development in these regions beyond the sole determinant of Extensive Margin.
Intensive Margin comparison between African CFA Zone Countries to Non-CFA Middle Africa and Western Africa Countries
Definition of Intensive Margin
Intensive margin, as measured in an index, refers to the ability of a country to expand and diversify its export base. Essentially, it captures the extent to which a country can increase the variety and quality of products it exports, rather than just focusing on the overall volume of total exports. This concept holds significant importance in assessing a country’s economic growth and development. A higher score on the intensive margin index indicates that the country has successfully enhanced its export structure by moving away from a limited range of products towards a more diverse and sophisticated export base. This indicates the country’s ability to adapt, innovate, and compete in a global market. Consequently, a strong performance on the intensive margin index suggests a higher probability of sustained economic progress and improved living standards.
Comparing Median Intervals for indicator Intensive Margin
The concept of Intensive Margin, as measured by an index, plays a crucial role in promoting economic growth and development. A higher Intensive Margin suggests that a country has enhanced its export base by diversifying and expanding the variety and quality of its products. This expansion signifies the country’s ability to adapt, innovate, and compete in the global market. In the context of the CFA franc zone and non-CFA middle/west Africa countries, the provided data indicates that non-CFA middle/west Africa countries had more yearly intervals with a higher median Intensive Margin from 1980 to 2014. This comparison suggests that non-CFA middle/west Africa countries have demonstrated a relatively stronger capability to improve their export structure, which can open avenues for sustained economic progress and improved living standards.
Export Diversification Index comparison between African CFA Zone Countries to Non-CFA Middle Africa and Western Africa Countries
Definition of Export Diversification Index
The Export Diversification Index, as measured by Theil index, serves as a vital indicator reflecting a country’s economic growth and development. This index provides an overall assessment of a nation’s export diversification, indicating the extent to which a country expands its product and market range in international trade. By diversifying exports, nations can mitigate the risks associated with over-dependence on a limited set of products or markets, fostering resilience in the face of economic shocks. A higher Export Diversification Index signifies a more diversified export base, indicating a broader range of industries and goods being exported. Enhanced export diversification can facilitate economic development by promoting technological progress, attracting foreign direct investment, and improving resource allocation. Consequently, policymakers and analysts closely monitor the Export Diversification Index to gauge a country’s economic resilience and potential for sustained growth.
Comparing Median Intervals for indicator Export Diversification Index
A higher Export Diversification Index has the potential to promote economic growth and development in a country. By diversifying exports, nations can reduce their vulnerability to external shocks and increase their economic resilience. A more diversified export base allows for a broader range of industries and goods to contribute to a country’s economic activity, fostering technological progress and attracting foreign investment. In the context of the CFA franc zone and non-CFA middle/west Africa countries, the available data shows that the CFA franc zone countries generally had more yearly intervals with a higher median Export Diversification Index than their non-CFA counterparts from 1980 to 2014. This suggests that, at least based on this metric, the CFA franc zone countries exhibited a relatively higher degree of export diversification during that period. However, it is important to consider additional factors and indicators to provide a comprehensive and nuanced comparative analysis between the two groups of countries in terms of their export diversification efforts and their impact on economic growth and development.
Food And Live Animals comparison between African CFA Zone Countries to Non-CFA Middle Africa and Western Africa Countries
Definition of Food And Live Animals
Food And Live Animals measured in Index refers to a metric used to assess the trade value and quantity of food and live animals within a country. This indicator holds significant importance as it allows for the analysis of a country’s economic growth and development. The movement in the index reflects changes in domestic consumption, production, and import/export patterns related to food and live animals. A higher index value signifies increased economic activity and potential improvements in food security, while a lower index value may indicate economic stagnation or challenges in the agricultural sector. Proper interpretation of this indicator provides valuable insights into a country’s overall economic health and assists policymakers in formulating appropriate measures to bolster agricultural development and ensure sustainable economic growth.
Comparing Median Intervals for indicator Food And Live Animals
A higher Food And Live Animals index generally indicates improved economic growth and development. The availability and consumption of food and live animals reflect the vitality of a country’s domestic market and agricultural sector. In the case of non-CFA middle/west Africa countries, the median values of Food And Live Animals have shown more intervals with higher medians compared to the CFA franc zone countries from 1980 to 2014. This suggests that non-CFA middle/west Africa countries may have experienced more consistent growth and development in terms of food production, consumption, and agricultural activities during this period. These findings imply the importance of policies and measures implemented by non-CFA middle/west Africa countries to enhance their agricultural sectors and ensure food security, ultimately contributing to their economic progress in the long term.
Crude Materials, Inedible, Except Fuels comparison between African CFA Zone Countries to Non-CFA Middle Africa and Western Africa Countries
Definition of Crude Materials, Inedible, Except Fuels
Crude materials, inedible, except fuels, measured in index, refers to an economic indicator that gauges the performance of a country’s non-edible raw materials, excluding fuels, over a certain period. This index provides crucial insight into a nation’s economic growth and development by capturing the trends in the production and utilization of these essential resources. The significance of this indicator lies in its ability to reflect changes in a country’s industrial sector, as the demand for crude materials is closely linked to manufacturing and construction activities. An increase in the index suggests a growing economy, as more raw materials are required to meet industrial demands. Conversely, a decline in the index may indicate a slowdown in economic activity. Hence, monitoring the fluctuations in this index is vital for policymakers, investors, and businesses to assess the overall health and trajectory of a country’s economic development.
Comparing Median Intervals for indicator Crude Materials, Inedible, Except Fuels
A higher median for Crude Materials, Inedible, Except Fuels in CFA franc zone countries compared to non-CFA middle/west Africa countries from 1980 to 2014 suggests that these CFA franc zone nations experienced more yearly intervals with a greater level of raw materials production. Considering the role of these materials in industries such as manufacturing and construction, this indicates a potentially higher level of economic activity and development within the CFA franc zone. However, it is important to note that other factors beyond Crude Materials, Inedible, Except Fuels, such as overall industrial policies, infrastructure, and political stability, may also influence economic growth. Therefore, a comprehensive analysis is needed to determine the true impact of these raw materials on a country’s economic development, particularly when comparing different regions.
Manufact Goods Classified Chiefly By Material comparison between African CFA Zone Countries to Non-CFA Middle Africa and Western Africa Countries
Definition of Manufact Goods Classified Chiefly By Material
Manufactured Goods Classified Chiefly By Material (MGCCM) measured in Index is a vital indicator of a country’s economic growth and development. This index encompasses various manufactured goods grouped according to their material composition, providing a comprehensive perspective on the industrial sector’s dynamism. By tracking the changes in the MGCCM index over time, policymakers and economists can gauge the level of industrial activity, identify potential bottlenecks in the production chain, and assess the overall health of the manufacturing sector. Moreover, the MGCCM index offers insights into a country’s level of technological advancement, competitiveness, and diversification, as it reflects the relative importance of different materials and sectors within the manufacturing industry. As such, this indicator serves as a valuable tool for formulating informed policies to enhance productivity, encourage innovation, and foster sustainable economic development.
Comparing Median Intervals for indicator Manufact Goods Classified Chiefly By Material
Step 1 - A higher level of Manufact Goods Classified Chiefly By Material tends to promote economic growth and development as it signifies a vibrant manufacturing sector, which is often associated with technological advancement, productivity gains, employment opportunities, and increased value-added production. This indicates a country’s ability to produce and supply a diverse range of manufactured goods, enabling it to meet domestic needs, export products, and compete in the global market.
Based on the dataframe provided, the median value of Manufact Goods Classified Chiefly By Material for non-CFA middle/west Africa countries appears to be higher than that of the CFA franc zone countries for most of the observed years from 1980 to 2014. This suggests that non-CFA middle/west Africa countries have experienced more intervals with a relatively higher level of material-based manufacturing output. This comparative insight implies that these non-CFA countries may have been able to foster a more robust and diversified manufacturing sector, contributing to their economic growth and development by capitalizing on their material resources and potential technological advancements. Furthermore, the consistently higher median for non-CFA middle/west Africa countries hints at the potential advantages of having greater autonomy and flexibility in monetary policy and currency arrangements, allowing for tailored approaches to support industrial growth and development priorities.
Machinery And Transport Equipment comparison between African CFA Zone Countries to Non-CFA Middle Africa and Western Africa Countries
Definition of Machinery And Transport Equipment
Machinery and Transport Equipment (MTE) measured in Index is a crucial indicator of a country’s economic growth and development. This index encompasses an array of capital goods, such as machinery, vehicles, and other equipment, which are vital for the production and transportation of goods and services. The MTE index provides insights into a country’s technological capacity, industrial productivity, and infrastructure development. Expansion in this index reflects investments in modernization, innovation, and efficiency improvements, thus bolstering production capabilities and overall economic performance. As such, a higher MTE index implies enhanced competitiveness, increased export potential, and improved living standards for a nation. Consequently, policymakers closely monitor this indicator to gauge the progress of economic development and identify areas for further investment to sustain long-term growth.
Comparing Median Intervals for indicator Machinery And Transport Equipment
Higher levels of Machinery And Transport Equipment (MTE) are generally associated with economic growth and development. This is because an increase in MTE signifies investment in modern infrastructure, advanced technology, and improved production capabilities. Accordingly, it can lead to increased industrial productivity, enhanced competitiveness, and higher living standards. Comparing the median MTE values between CFA franc zone and non-CFA middle/west Africa countries from 1980 to 2014, it is observed that the non-CFA countries had more yearly intervals with a higher median. This suggests that non-CFA countries in middle/west Africa have made relatively more progress in terms of investing in and modernizing their machinery and transport equipment, potentially contributing to their economic growth and development. However, a more comprehensive analysis would be required to assess the overall impact of MTE on the respective economies.
Miscellaneous Manufactured Articles comparison between African CFA Zone Countries to Non-CFA Middle Africa and Western Africa Countries
Definition of Miscellaneous Manufactured Articles
The measurement of Miscellaneous Manufactured Articles in Index is a significant indicator of a country’s economic growth and development. These articles encompass a wide range of goods, often categorized as non-durable consumer products, including textiles, clothing, footwear, and household appliances. The index provides insights into the production and consumption patterns of these manufactured articles, reflecting the level of economic activity and consumer demand in an economy. An increase in the index suggests a rise in manufacturing output and potential job creation, as well as a flourishing domestic market. Additionally, a higher index value may indicate positive strides in a country’s industrial capacity and competitiveness, leading to potential exports and foreign exchange earnings. Therefore, monitoring the Miscellaneous Manufactured Articles index plays a crucial role in understanding an economy’s trajectory and its overall economic well-being.
Comparing Median Intervals for indicator Miscellaneous Manufactured Articles
The relationship between a higher index of Miscellaneous Manufactured Articles and economic growth and development is of significant interest. A higher index generally suggests an increase in manufacturing output, reflecting positive economic activity and consumer demand. However, it is important to note that this relationship may vary in different contexts. Analyzing the given data from 1980 to 2014, it can be observed that non-CFA middle/west Africa countries had more yearly intervals with a higher median index compared to CFA franc zone countries. This implies that non-CFA middle/west Africa countries may have experienced relatively stronger manufacturing growth and development in the Miscellaneous Manufactured Articles sector during the given period. This insight leads us to further explore the underlying factors contributing to this divergence and evaluate the potential implications for overall economic progress in these regions.
Export Quality Index comparison between African CFA Zone Countries to Non-CFA Middle Africa and Western Africa Countries
Definition of Export Quality Index
The Export Quality Index, as measured in index form, serves as a valuable indicator of a country’s economic growth and development. This index reflects the overall quality of a country’s exports, offering insights into the competitiveness and sophistication of its industries. With a higher index value indicating higher export quality, policymakers and analysts can gauge a nation’s progress in upgrading its production capabilities, diversifying its export base, and venturing into higher value-added industries. The Export Quality Index thus allows for the assessment of a country’s ability to attract higher levels of foreign investment, foster technological advancements, and consequently drive sustainable economic growth and development.
Comparing Median Intervals for indicator Export Quality Index
A higher Export Quality Index, which serves as an indicator of the overall quality of a country’s exports, is likely to promote economic growth and development. A higher index suggests greater competitiveness and sophistication of a country’s industries, which can attract higher levels of foreign investment and foster technological advancements. Analyzing the provided median Export Quality Index data from 1980 to 2014, it can be observed that CFA franc zone countries had more yearly intervals with a higher median compared to non-CFA middle/west Africa countries. This insight implies that CFA franc zone countries, benefiting from monetary stability and economic attractiveness, may have been more successful in upgrading their production capabilities, diversifying their export base, and venturing into higher value-added industries, whereas non-CFA countries in the region might have faced challenges in achieving similar export quality improvements.
Debt comparison between African CFA Zone Countries to Non-CFA Middle Africa and Western Africa Countries
Definition of Debt
Debt measured as a percentage of GDP represents the ratio of a country’s total debt to its gross domestic product. This indicator holds significance as it offers insights into a nation’s economic growth and development. The relationship between debt and GDP provides a measure of the country’s ability to generate income and repay its debt obligations. A high debt-to-GDP ratio signifies that the country’s debt burden is relatively large, which can potentially hinder economic progress by diverting resources away from productive investments. Conversely, a lower ratio implies a healthier fiscal position and greater capacity for economic expansion. Evaluating debt in relation to GDP assists policymakers, investors, and analysts in assessing a country’s financial stability and sustainability, which are crucial factors for fostering long-term growth and development.
Comparing Median Intervals for indicator Debt
The impact of higher debt on economic growth and development is a topic that has been subject to differing perspectives. While proponents argue that higher debt can stimulate economic growth through increased investment and government spending, critics point to the potential burden of debt service, which could crowd out productive investments and hinder long-term development. In the case of the CFA franc zone and non-CFA middle/west Africa countries, the median debt levels from 1980 to 2015 indicate that the latter experienced more intervals with higher median debt. This comparative insight suggests that non-CFA middle/west Africa countries faced a greater challenge in managing their debt burdens, potentially limiting their ability to invest in productive sectors and achieve sustainable growth. However, it is important to note that debt alone cannot fully explain the economic performance of these countries, as other factors such as governance, institutional quality, and external shocks also play vital roles.
Net Lending/borrowing (also Referred As Overall Balance) comparison between African CFA Zone Countries to Non-CFA Middle Africa and Western Africa Countries
Definition of Net Lending/borrowing (also Referred As Overall Balance)
Net lending/borrowing, also known as the overall balance, is a crucial indicator of a country’s economic growth and development, measured as a percentage of GDP. It signifies the difference between revenue and total expenditure of a government, based on the IMF’s Government Finance Statistics Manual (GFSM 2014). This measure excludes policy lending and is calculated by subtracting total expenditure and net lending from total revenue and grants. Net lending/borrowing reveals the fiscal position of a country, reflecting the extent to which a government is borrowing or lending funds. A positive overall balance implies that a country is generating more revenue than it spends, depicting economic progress and the ability to save or invest. Conversely, a negative overall balance indicates that a nation is borrowing more than it earns, highlighting potential financial vulnerability and the need for external funding. By examining net lending/borrowing as a percentage of GDP, analysts can assess a country’s financial stability, fiscal discipline, and its capacity for sustainable economic growth.
Comparing Median Intervals for indicator Net Lending/borrowing (also Referred As Overall Balance)
The analysis of the median net lending/borrowing (overall balance) from 1990 to 2023 reveals that both CFA franc zone countries and non-CFA middle/west Africa countries have similar intervals where their respective medians were higher. This suggests that both groups have experienced periods of positive overall balance, indicating the capability to generate more revenue than expenditure. However, it is important to note that the overall balance alone may not directly promote economic growth and development. Other factors such as government spending efficiency, investment allocation, and economic policies play a vital role in leveraging the positive effects of net lending/borrowing. Therefore, a comprehensive assessment of these additional factors is necessary to gain a more nuanced understanding of the impact of net lending/borrowing on the economic growth and development of both CFA franc zone countries and non-CFA middle/west Africa countries.
Expenditure comparison between African CFA Zone Countries to Non-CFA Middle Africa and Western Africa Countries
Definition of Expenditure
Expenditure measured in % of GDP is an important indicator used to assess a country’s economic growth and development. It quantifies the overall level of spending within an economy relative to its Gross Domestic Product (GDP), providing insights into the allocation of resources within the country. By measuring expenditure as a percentage of GDP, it captures the magnitude and patterns of consumption, investment, government spending, and net exports. A higher percentage of expenditure suggests increased economic activity, potentially signaling robust growth and development. Additionally, examining expenditure components such as consumption or investment can further elucidate the drivers of economic performance, facilitating targeted policy interventions to foster sustainable growth and development.
Comparing Median Intervals for indicator Expenditure
Higher expenditure can play a significant role in promoting economic growth and development. While it is important to note that causation may be influenced by various factors and should be analyzed comprehensively, increased expenditure indicates higher levels of economic activity and potential investment, which can stimulate aggregate demand and production. However, considering the specific comparison between the CFA franc zone countries and non-CFA middle/west Africa countries, the available data suggests a relatively equal distribution of intervals where their respective median expenditure was higher from 1990 to 2023. This implies that both groups have experienced periods of higher expenditure and potential economic growth. Further analysis of the factors influencing expenditure patterns and their impact on economic performance is necessary to draw more precise comparative insights.
Real Non-oil GDP Growth comparison between African CFA Zone Countries to Non-CFA Middle Africa and Western Africa Countries
Definition of Real Non-oil GDP Growth
Real non-oil GDP growth is a metric used to assess the economic development and growth of a country. It represents the percentage change in the value of goods and services produced in a nation, excluding the oil sector and adjusted for changes in prices. By focusing on non-oil sectors, this indicator provides a more accurate representation of a country’s overall economic performance and potential. A higher real non-oil GDP growth signifies increased production and consumption, implying greater economic activity and development. This metric is particularly significant as it helps policymakers and analysts gauge the diversification and resilience of an economy, as well as identify sectors with growth potential that can drive long-term stability and prosperity.
Comparing Median Intervals for indicator Real Non-oil GDP Growth
A higher Real Non-oil GDP Growth is generally associated with economic growth and development, as it signifies increased production and consumption within a country. This indicator reflects the expansion of non-oil sectors, which are crucial for diversifying the economy and strengthening its resilience. Analyzing the provided data, it is evident that non-CFA middle/west Africa countries experienced more yearly intervals with a higher median Real Non-oil GDP Growth compared to the CFA franc zone countries from 2004 to 2023. This suggests that the non-CFA middle/west Africa countries have been able to achieve more consistent economic growth, potentially due to greater flexibility in monetary policies and a more targeted approach to promote non-oil sectors. However, a comprehensive analysis considering various other factors would be necessary to fully understand the causal relationships and implications of these growth patterns.
Overall Fiscal Balance, Including Grants comparison between African CFA Zone Countries to Non-CFA Middle Africa and Western Africa Countries
Definition of Overall Fiscal Balance, Including Grants
The Overall Fiscal Balance, Including Grants measured in % of GDP, pertains to the assessment of a country’s total revenue and expenditure, encompassing both direct and indirect taxes as well as grants received. This metric holds considerable significance as it serves as an essential indicator of a country’s economic growth and development. A positive overall fiscal balance indicates that a country is generating more revenue than it is spending, enabling it to accumulate financial resources for investment in various sectors. This surplus can be utilized for infrastructure development, social welfare programs, and additional investment, thereby fostering sustainable economic growth. Conversely, a negative overall fiscal balance suggests that a country’s expenditure exceeds its revenue, leading to increased borrowing and potential macroeconomic imbalances. Consequently, a healthy and positive overall fiscal balance, including grants, becomes pivotal for promoting economic stability and long-term development.
Comparing Median Intervals for indicator Overall Fiscal Balance, Including Grants
A higher Overall Fiscal Balance, Including Grants has the potential to promote economic growth and development, as it reflects a country’s ability to generate more revenue than it spends. This surplus can be utilized for investment in various sectors, infrastructure development, and social welfare programs, thereby stimulating economic activity and fostering long-term growth. Based on the provided dataframe, from 2004 to 2023, the CFA franc zone countries had more yearly intervals with a higher median for Overall Fiscal Balance, Including Grants compared to non-CFA middle/west Africa countries. This suggests that the CFA franc zone countries may have been able to accumulate more financial resources for investment and development compared to their non-CFA counterparts. However, it is important to consider other factors and indicators alongside Overall Fiscal Balance, Including Grants to gain a comprehensive understanding of a country’s economic growth and development potential.
Overall Fiscal Balance, Excluding Grants comparison between African CFA Zone Countries to Non-CFA Middle Africa and Western Africa Countries
Definition of Overall Fiscal Balance, Excluding Grants
The Overall Fiscal Balance, Excluding Grants measured in % of GDP reflects the net outcome of a country’s government budget excluding grants received. This indicator provides valuable insights into the economic growth and development of a nation. A positive fiscal balance, implying government revenue exceeding expenditure, indicates potential fiscal sustainability, which can encourage private investment and contribute to economic stability. Conversely, a negative balance could suggest a reliance on debt, which may impede growth prospects. By assessing the overall fiscal position of a country, this measure enables policymakers and investors to gauge the government’s commitment to responsible fiscal management and provides a basis for informed decision-making in pursuit of sustainable economic development.
Comparing Median Intervals for indicator Overall Fiscal Balance, Excluding Grants
Higher overall fiscal balance, excluding grants, is often perceived as a catalyst for economic growth and development. By maintaining a positive balance, governments can increase public investments, stimulate aggregate demand, and create a conducive environment for private sector activities. In the case of the CFA franc zone countries, the data indicates that they had more yearly intervals with a higher median overall fiscal balance from 2004 to 2023 compared to non-CFA middle/west Africa countries. This implies that, on average, the CFA franc zone countries have been more successful in managing their fiscal positions and potentially leveraging their fiscal resources to support growth and development. However, it is important to consider other factors such as structural characteristics, monetary policy frameworks, and governance that can influence the overall economic performance of these countries.
Government Revenue, Excluding Grants comparison between African CFA Zone Countries to Non-CFA Middle Africa and Western Africa Countries
Definition of Government Revenue, Excluding Grants
Government revenue, excluding grants measured as a percentage of Gross Domestic Product (GDP), signifies the amount of income generated by a country’s government through taxes, fees, and other sources, excluding external assistance. This indicator is crucial in assessing a nation’s economic growth and development as it reflects the government’s ability to finance its expenditure, including public goods and services, infrastructure development, and social welfare programs. A higher government revenue, excluding grants as a percentage of GDP, generally suggests a stronger fiscal position, implying that the government has more resources at its disposal to foster economic growth, address societal needs, and mitigate economic uncertainties. Conversely, a lower ratio may indicate potential challenges in sustaining government operations, limiting investment in critical sectors, and hampering long-term development prospects. Thus, monitoring and maintaining a healthy level of government revenue, excluding grants, as a proportion of GDP is paramount for ensuring sustainable economic progress and stability.
Comparing Median Intervals for indicator Government Revenue, Excluding Grants
Higher government revenue, excluding grants, has the potential to promote economic growth and development, according to Keynesian principles. By generating more income through taxes and other sources, governments can finance public goods, infrastructure projects, and social welfare programs, thereby stimulating aggregate demand and employment. Additionally, higher government revenue allows for greater fiscal flexibility, enabling countries to effectively respond to economic downturns through countercyclical policies. In the case of the CFA franc zone countries, the data shows that they had more yearly intervals with a higher median for government revenue, excluding grants, compared to non-CFA middle/west Africa countries from 2004 to 2023. This suggests that CFA franc zone countries may have benefited from stronger fiscal capacity, potentially supporting their economic growth and development. However, further analysis is necessary to comprehensively evaluate the overall impact of government revenue on these countries’ economies, taking into account factors such as expenditure efficiency, economic structure, and policy coordination.
Government Debt comparison between African CFA Zone Countries to Non-CFA Middle Africa and Western Africa Countries
Definition of Government Debt
Government Debt measured as a percentage of GDP refers to the total outstanding debt of a government relative to the size of its economy. As an indicator, it provides important insights into a country’s economic growth and development. A higher debt-to-GDP ratio can indicate that a government has engaged in excessive borrowing, potentially incurring budget deficits to stimulate economic activity or finance public projects. While this may be considered beneficial in the short term, as it can spur growth and job creation, it also raises concerns about the sustainability of debt levels and the potential crowding-out effect on private investment. Therefore, by monitoring the government debt-to-GDP ratio, policymakers and investors can gain valuable information about the fiscal health of a country and the potential risks it may face in terms of economic stability and development.
Comparing Median Intervals for indicator Government Debt
step 1 - A higher Government Debt does not necessarily promote economic growth and development in accordance with Keynesian principles. While increased debt can be used to stimulate short-term economic activity, excessive borrowing and persistent budget deficits may lead to concerns about sustainability and potential crowding-out effects on private investment. Therefore, it is crucial to assess the effectiveness of government spending and investment initiatives to ensure they foster long-term growth, job creation, and infrastructure development. Additionally, managing debt levels through appropriate fiscal policies that balance economic stability and debt sustainability is vital.
Non-CFA middle/west Africa countries, when compared to the CFA franc zone, have displayed more intervals with a higher median Government Debt from 2004 to 2023. This suggests that countries outside the CFA franc zone have faced greater challenges in managing their debt levels and may have encountered difficulties in balancing growth-oriented policies with debt sustainability. It highlights the importance for these non-CFA countries to carefully monitor their debt accumulation and ensure efficient utilization of borrowed funds to drive sustainable economic development. Moreover, fostering an environment conducive to private investment and implementing structural reforms can assist in reducing debt burdens and promoting long-term growth prospects.
Broad Money comparison between African CFA Zone Countries to Non-CFA Middle Africa and Western Africa Countries
Definition of Broad Money
Broad money, measured as a percentage of gross domestic product (GDP), serves as a crucial indicator of a country’s economic growth and development. It reflects the total amount of money circulating within an economy, including both physical currency and various types of deposits. By representing the magnitude of financial liquidity available to support economic activities, it provides insights into a nation’s monetary conditions and potential for expansion. A higher ratio of broad money to GDP suggests increased financial resources for investment, consumption, and economic transactions, supporting growth prospects. Additionally, a consistent growth in this indicator may signify a stable and well-functioning financial system, thereby bolstering investor confidence and attracting capital inflows. Consequently, policymakers and analysts closely monitor broad money as a barometer of a country’s economic performance and stability.
Comparing Median Intervals for indicator Broad Money
A higher level of Broad Money generally promotes economic growth and development. It signifies increased financial resources available for investment, consumption, and economic transactions, which in turn stimulates economic activity. In the case of the CFA franc zone countries, the data provided indicates that they had more yearly intervals with a higher median Broad Money compared to non-CFA middle/west Africa countries from 2004 to 2023. This suggests that the CFA franc zone countries may have enjoyed relatively greater financial liquidity, potentially facilitating economic expansion. However, it is important to note that other factors such as exchange rate regime, currency pegging, capital movement, and access to financing can influence the overall economic outcomes of these countries. Thus, a comprehensive analysis considering these factors is necessary to draw a definitive comparative insight between the two groups in terms of Broad Money and its impact on economic growth and development.
Claims On Nonfinancial Private Sector comparison between African CFA Zone Countries to Non-CFA Middle Africa and Western Africa Countries
Definition of Claims On Nonfinancial Private Sector
Claims on Nonfinancial Private Sector (% change) refers to the measure of the percentage variation in the extent of borrowing and lending activities and liabilities between financial institutions and the nonfinancial private sector in a given country. This indicator holds great significance as it reflects the dynamism and expansion of credit within the economy, fostering economic growth and development. A positive % change suggests an increased availability of credit to the nonfinancial private sector, which can stimulate investments, consumption, and entrepreneurial activities. Consequently, this indicator serves as a gauge of a nation’s economic vitality, providing insights into the functioning of its financial sector and the overall health of its economy.
Comparing Median Intervals for indicator Claims On Nonfinancial Private Sector
Considering the relationship between higher Claims On Nonfinancial Private Sector and economic growth and development, it is widely accepted that an increase in credit availability to the nonfinancial private sector plays a crucial role in promoting economic activity. The data provided indicates that the non-CFA middle/west Africa countries have experienced more intervals with a higher median of Claims On Nonfinancial Private Sector compared to the CFA franc zone countries from 2004 to 2022. This suggests that the non-CFA middle/west Africa countries have had a greater degree of credit expansion, which may have contributed to their economic growth and development. It is important to note that other factors, such as institutional quality and macroeconomic stability, should be considered when assessing the overall economic performance of these countries.
Claims On Nonfinancial Private Sector comparison between African CFA Zone Countries to Non-CFA Middle Africa and Western Africa Countries
Definition of Claims On Nonfinancial Private Sector
Claims on Nonfinancial Private Sector (% of GDP) refers to a measure that represents the total amount of financial claims held by the nonfinancial private sector in relation to a country’s Gross Domestic Product (GDP). This indicator holds significance as it provides insights into the level of financial intermediation and liquidity available for private sector activities within an economy. A higher percentage implies a larger pool of resources accessible to the nonfinancial private sector, which can stimulate investment, consumption, and overall economic growth. Additionally, a robust and well-functioning financial sector, as indicated by a higher share of claims on the private sector, can contribute to the development of an economy by promoting efficient capital allocation and supporting business expansion and innovation. Therefore, monitoring the Claims on Nonfinancial Private Sector (% of GDP) can offer a valuable perspective on a country’s economic dynamics and the potential for sustained growth and development.
Comparing Median Intervals for indicator Claims On Nonfinancial Private Sector
The higher median Claims On Nonfinancial Private Sector in CFA franc zone countries compared to non-CFA middle/west Africa countries from 2004 to 2022 suggests that the former may have experienced more frequent intervals of financial resources accessible to the private sector. This observation aligns with the Keynesian view that increased claims on the private sector can stimulate investment and consumption, contributing to economic growth and development. However, it is important to note that this comparison does not account for other factors influencing economic performance, such as government policies, institutional frameworks, or external shocks. Therefore, a comprehensive analysis is necessary to ascertain the overall impact of Claims On Nonfinancial Private Sector on the economic growth and development of both CFA franc zone and non-CFA middle/west Africa countries.
External Current Account, Incl.grants comparison between African CFA Zone Countries to Non-CFA Middle Africa and Western Africa Countries
Definition of External Current Account, Incl.grants
The concept of the External Current Account, including grants, measured as a percentage of the Gross Domestic Product (GDP), represents the balance of a country’s international transactions in terms of trade in goods, services, income, and current transfers. It serves as a crucial indicator of a country’s economic growth and development by reflecting its ability to generate surplus or deficit in its foreign trade. A positive current account implies that the value of exports exceeds imports, demonstrating a competitive advantage in international markets, promoting economic growth, and attracting foreign investments. Conversely, a negative current account indicates a trade deficit, which could imply increased dependence on foreign borrowing or reduced competitiveness. Consequently, monitoring and analyzing the External Current Account % of GDP provides policymakers with valuable insights into a country’s economic performance, helping them devise appropriate measures to ensure sustainable growth and development.
Comparing Median Intervals for indicator External Current Account, Incl.grants
A higher External Current Account, including grants, is often seen as promoting economic growth and development. It indicates that a country is able to generate a surplus in its foreign trade, displaying competitiveness in the international market and attracting foreign investments. In analyzing the provided data from 2004 to 2023, it is evident that the CFA franc zone countries had more yearly intervals with a higher median External Current Account, including grants, compared to non-CFA middle/west Africa countries. This suggests that, on average, CFA franc zone countries have been relatively more successful in achieving trade surpluses and harnessing the benefits associated with a positive External Current Account, including grants. However, it is important to consider other factors that contribute to economic growth and development, as the impact of External Current Account figures alone may be influenced by various internal and external dynamics.
Imports Of Goods And Services comparison between African CFA Zone Countries to Non-CFA Middle Africa and Western Africa Countries
Definition of Imports Of Goods And Services
Imports of goods and services measured as a percentage of Gross Domestic Product (GDP) provide a meaningful indicator of a country’s economic growth and development. This metric signifies the extent to which a nation relies on external sources for meeting domestic demand. A high percentage of imports relative to GDP implies that a country heavily relies on foreign goods and services, which can hinder domestic production and potentially lead to trade imbalances. Conversely, a lower import percentage showcases a higher level of self-sufficiency and a more robust domestic industry. Monitoring imports of goods and services as a proportion of GDP allows policymakers and economists to assess the competitiveness and resilience of a country’s domestic sector, as well as the nation’s overall economic performance. It serves as a vital measure of economic openness, highlighting how efficiently a nation engages with the global economy, facilitating informed decision-making and promoting sustainable growth strategies.
Comparing Median Intervals for indicator Imports Of Goods And Services
A higher percentage of Imports of Goods and Services can potentially promote economic growth and development. By importing a diverse range of goods and services, countries gain access to resources, technologies, and expertise that may not be domestically available, thereby stimulating productivity and innovation. However, when comparing the median Imports of Goods and Services between the CFA franc zone and non-CFA middle/west Africa countries from 2004 to 2023, it becomes evident that non-CFA middle/west Africa countries generally had more yearly intervals with a higher median. This suggests that these countries may be more actively engaging in international trade, potentially benefiting their economies through increased market participation, international connections, and knowledge transfer. The higher median of Imports of Goods and Services for non-CFA middle/west Africa countries indicates their efforts towards diversification, integration into the global economy, and potential improvements in their economic growth and development.
Trade Balance comparison between African CFA Zone Countries to Non-CFA Middle Africa and Western Africa Countries
Definition of Trade Balance
Trade balance, measured as a percentage of gross domestic product (GDP), reflects the difference between a country’s exports and imports. This metric provides insight into the health of a nation’s economy and its developmental trajectory. A positive trade balance, where exports exceed imports, signifies a higher level of economic growth, as it indicates a competitive advantage in producing goods and services. This surplus encourages investment and job creation, strengthening the country’s economic foundation. On the other hand, a negative trade balance implies a higher level of imports, potentially indicating a lack of international competitiveness and reliance on foreign production. Consequently, a persistent trade deficit can hamper economic development, hindering domestic growth and investment. Thus, monitoring the trade balance as a percentage of GDP aids policymakers in understanding a country’s economic performance and framing appropriate economic policies.
Comparing Median Intervals for indicator Trade Balance
The concept of Trade Balance, measured as a percentage of GDP, plays a significant role in determining a country’s economic growth and development. A higher Trade Balance generally promotes economic expansion, as it reflects a surplus in exports over imports. This surplus indicates a country’s competitive advantage in producing goods and services, driving investment and job creation. Comparatively, analyzing the median Trade Balance for CFA franc zone countries and non-CFA middle/west Africa countries from 2004 to 2023 reveals that CFA franc zone countries had more yearly intervals with a higher median Trade Balance. This insight suggests that CFA franc zone countries have been relatively better positioned to harness the economic benefits associated with a positive Trade Balance compared to their non-CFA counterparts. However, it is essential to consider other factors, such as the overall economic structure and policies, to gain a comprehensive understanding of the relationship between Trade Balance and economic growth in both groups of countries.
Real Effective Exchange Rates comparison between African CFA Zone Countries to Non-CFA Middle Africa and Western Africa Countries
Definition of Real Effective Exchange Rates
The concept of Real Effective Exchange Rates (REER) measured in Annual Average Index, 2010=100 serves as a crucial indicator for a country’s economic growth and development. This measure takes into account not only nominal exchange rates but also inflation differentials between countries, providing a broader perspective on a nation’s competitiveness. By comparing REER to its base year value, policymakers and analysts can assess changes in relative prices and gauge a country’s external competitiveness over time. A higher REER suggests an appreciation of the country’s currency, which may have implications for trade and export competitiveness. Conversely, a lower REER indicates a depreciation, which could boost exports but lead to higher import costs. Additionally, REER can be helpful in identifying potential imbalances in a country’s current account, as it reflects changes in the value of a currency against a basket of trade partners. Ultimately, monitoring changes in REER allows policymakers to make informed decisions regarding exchange rate policies, trade strategies, and ensure sustainable economic growth.
Comparing Median Intervals for indicator Real Effective Exchange Rates
A higher Real Effective Exchange Rates (REER) has the potential to promote economic growth and development. It can indicate a country’s increased competitiveness in the global market, which can lead to an expansion in exports and enhanced trade performance. This, in turn, may attract foreign investment, stimulate domestic production, and generate employment opportunities. However, when comparing the median REER from 2004 to 2022, it is notable that non-CFA middle/west Africa countries exhibited more yearly intervals with a higher median compared to CFA franc zone countries. This suggests that non-CFA countries may have experienced relatively stronger exchange rate dynamics, potentially benefiting their economic growth and development. Nonetheless, it is important to consider a range of factors beyond REER to provide a comprehensive analysis of the economic performance and prospects of these countries.
Nominal Effective Exchange Rates comparison between African CFA Zone Countries to Non-CFA Middle Africa and Western Africa Countries
Definition of Nominal Effective Exchange Rates
Nominal Effective Exchange Rates (NEER) measured in Annual Average Index, 2010 = 100 capture the relative value of a country’s currency against a basket of currencies of its major trading partners, adjusting for trade weights. As an indicator of economic growth and development, NEER offers valuable insights into a country’s competitiveness in international markets. A higher NEER suggests an appreciation of the country’s currency, making its exports relatively more expensive and imports cheaper. This can dampen economic growth by reducing export competitiveness and potentially causing a trade deficit. Conversely, a lower NEER indicates currency depreciation, potentially boosting exports and economic growth. Hence, monitoring changes in NEER is crucial for policymakers in assessing a country’s external competitiveness and formulating strategies to enhance growth and development.
Comparing Median Intervals for indicator Nominal Effective Exchange Rates
Higher Nominal Effective Exchange Rates (NEER) can potentially promote economic growth and development in a country. However, it is important to consider the specific circumstances and characteristics of each country. In the case of the CFA franc zone countries compared to non-CFA middle/west Africa countries, the dataframe provided indicates that the median NEER for CFA franc zone countries was generally higher than that of non-CFA countries from 2004 to 2022. This suggests a relatively stronger position in international markets for CFA franc zone countries, which could potentially support their export competitiveness and economic growth. However, it is essential to analyze other factors alongside NEER, such as domestic policies, structural factors, and external shocks, to draw a comprehensive conclusion regarding the overall economic growth and development of these countries.
External Debt, Official Debt, Debtor Based comparison between African CFA Zone Countries to Non-CFA Middle Africa and Western Africa Countries
Definition of External Debt, Official Debt, Debtor Based
External debt refers to the total amount of money that a country owes to foreign creditors as a result of borrowing or receiving loans. It includes both official debt, which is the amount owed to foreign governments or international financial institutions, and debtor-based measured in % of GDP, which represents the total debt of a country compared to its economic output. This indicator is significant in assessing a country’s economic growth and development as a high level of external debt can restrict a nation’s ability to invest in domestic projects, spur economic growth, and provide social services. It can lead to a higher debt servicing burden, limited fiscal space, and reduced confidence from international investors, potentially hampering development efforts and stunting long-term economic progress. Therefore, managing external debt and ensuring sustainable levels of borrowing is crucial for a country’s economic stability and future prospects.
Comparing Median Intervals for indicator External Debt, Official Debt, Debtor Based
Step 1 - The link between higher External Debt, Official Debt, and Debtor Based measured in % of GDP and economic growth and development is a complex issue. From a Keynesian perspective, higher debt levels can stimulate economic growth through increased government spending, which in turn boosts aggregate demand. However, there is a point beyond which excessive debt becomes detrimental, as it can lead to unsustainable debt burdens, higher interest payments, and limited fiscal space for investment in productive sectors. Therefore, the relationship between debt and economic growth depends on the level of debt, its composition, and the effectiveness of fiscal policies implemented to manage it.
Based on the dataframe provided, step 2 - Non-CFA middle/west Africa countries have shown a higher median for External Debt, Official Debt, and Debtor Based measured in % of GDP compared to CFA franc zone countries from 2004 to 2023. This indicates that non-CFA middle/west Africa countries have had more yearly intervals with a higher debt burden relative to their economic output. While this may suggest a higher level of external borrowing for non-CFA countries, it is important to consider the specific economic and policy context of each country. Factors such as prudent debt management, effective utilization of borrowed funds, and macroeconomic stability play crucial roles in determining whether higher debt levels contribute positively or negatively to economic growth and development.
Consumer Prices, Average comparison between African CFA Zone Countries to Non-CFA Middle Africa and Western Africa Countries
Definition of Consumer Prices, Average
Consumer prices, measured as the annual average % change, reflect the general trend in the prices of goods and services consumed by households over time. As an indicator of a country’s economic growth and development, it bears significance as it encapsulates the effects of inflation or deflation on consumers’ cost of living. A low and stable consumer price index is generally associated with a healthy economic environment, characterized by stable demand, favorable investment conditions, and overall price stability. It provides valuable insights into the purchasing power, standard of living, and welfare of households, aiding policymakers in formulating appropriate monetary and fiscal policies to promote sustainable growth and maintain macroeconomic stability.
Comparing Median Intervals for indicator Consumer Prices, Average
A higher Consumer Prices, Average is generally believed to promote economic growth and development in accordance with Keynesian economic principles. Higher consumer prices indicate a favorable inflationary environment, which stimulates consumption and investment. It incentivizes businesses to expand production, leading to increased economic activity and job creation. However, when comparing the median Consumer Prices, Average between the CFA franc zone and non-CFA middle/west Africa countries from 2004 to 2023, it is evident that non-CFA countries had more yearly intervals with a higher median. This suggests that non-CFA countries may have experienced relatively higher levels of inflation, potentially indicating stronger domestic demand and economic growth. It is worth noting that further analysis is needed to understand the specific factors driving these differences and their implications for overall economic development.
Consumer Prices, End Of Period comparison between African CFA Zone Countries to Non-CFA Middle Africa and Western Africa Countries
Definition of Consumer Prices, End Of Period
Consumer Prices, End Of Period measured in Annual average % change refers to the rate at which consumer prices in a country increase or decrease over a given year. As an indicator of economic growth and development, it holds significant importance. Changes in consumer prices reflect the overall level of inflation, which in turn affects the purchasing power of individuals and the stability of an economy. When consumer prices rise rapidly, it can erode people’s income, reduce their standard of living, and discourage savings and investments. On the contrary, low and stable consumer price inflation promotes economic stability, encourages consumption and investment, and facilitates long-term planning by businesses and households. Thus, tracking and understanding the Annual average % change in Consumer Prices, End Of Period allows policymakers to make informed decisions on monetary policy, fiscal measures, and structural reforms to ensure sustainable economic growth and development in a country.
Comparing Median Intervals for indicator Consumer Prices, End Of Period
A higher Consumer Prices, End Of Period does not necessarily promote economic growth and development, as it can also signify inflationary pressures and erode purchasing power. However, comparing the median values of Consumer Prices, End Of Period between CFA franc zone countries and non-CFA middle/west Africa countries from 2004 to 2023 reveals that non-CFA countries generally experienced more yearly intervals with higher median consumer prices. This suggests that non-CFA countries may have faced a greater challenge in managing inflation and maintaining price stability. It is essential to consider the underlying factors driving inflation in both sets of countries, such as monetary policy effectiveness, fiscal discipline, structural reforms, and external shocks, to better understand the implications of divergent consumer price trends on economic growth and development.
Terms Of Trade comparison between African CFA Zone Countries to Non-CFA Middle Africa and Western Africa Countries
Definition of Terms Of Trade
Terms of Trade refers to the ratio of a country’s export prices to its import prices, expressed as an index with a base year of 2010 set at 100. This measure is significant as it provides insights into a country’s economic growth and development. A favorable or improved terms of trade indicates that a nation is receiving higher prices for its export goods relative to the prices it pays for imported goods. This can be advantageous for a country’s economic progress as it leads to an increase in export revenue, which can be utilized for developmental projects or investment in human capital. Additionally, an improved terms of trade can contribute to a country’s trade surplus, bolstering its foreign exchange reserves and allowing for imports of technology, machinery, and other essential inputs required for economic growth. Thus, monitoring and analyzing terms of trade can help policymakers evaluate the economic performance and competitiveness of a nation.
Comparing Median Intervals for indicator Terms Of Trade
In analyzing whether a higher Terms of Trade promotes economic growth and development, empirical evidence suggests that it can have positive effects. The data presented, which compares the median Terms of Trade for CFA franc zone and non-CFA franc countries from 2004 to 2023, reveals that CFA franc zone countries experienced more yearly intervals with a higher median. This indicates that, on average, CFA franc zone countries had better relative prices for their exports compared to their imports more frequently during this period. Although causality cannot be directly inferred from this observation, a higher Terms of Trade generally implies increased export revenue, which can be utilized for investments and development projects. However, it is important to consider that other factors such as domestic policies, economic diversification, and productivity levels also play significant roles in shaping economic growth and development. Consequently, while a favorable Terms of Trade can contribute to positive economic outcomes, it alone cannot guarantee sustained growth and development. Further analysis is required to comprehensively evaluate the impact of Terms of Trade on economic performance in the CFA franc zone and non-CFA middle/west Africa countries.
Data Source
All data is sourced from the Internation Monetary Fund (IMF). If a data query had no data whatsoever for a metric for less than 80% of the countries the CFA, Middle Africa or Central Africa zone the metric is automatically ommited. With additional consideration for the completeness of the data, the following metrics were ommitted from the analysis because they had several missing datapoints:
General Government Net Lending/borrowing
General Government Gross Debt
Beverages, Tobacco
Mineral Fuels, Lubricants And Related Materials
Animal, Vegetable Oils, Fats
Chemicals comparison
Commodity & Transactions Not Classified Accord To Kind